Interactive Data Tools in the Tahoe Region
We developed a suite of analytical, interactive data tools to support urban planning and environmental projection in Lake Tahoe. The tools were created using R, Shiny, and Python and are used by agency staff, key stakeholders, and members of the public to enhance planning processes. The tools allow users to quickly visualize and analyze key regional datasets including GIS, Census, transportation, land use, and demographics.
Key Features
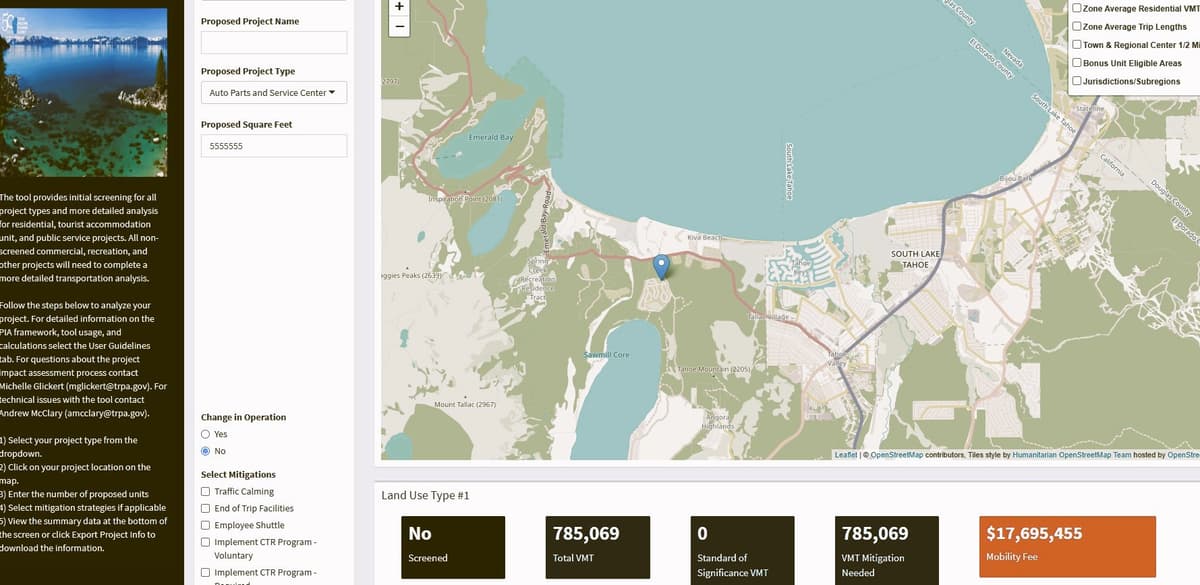
- ✓Project Impact Assessment Tool (PIA)
- ✓Tahoe Effective Population Model (TEMP)
- ✓Interactive GIS & Census data visualizations
- ✓Transportation & land use dataset integration
- ✓Demographics & regional trend analysis
- ✓Configurable scenario modeling
- ✓Used by agency staff, stakeholders & the public
- ✓Web-based deployment via shinyapps.io
Tech Stack
RShinyPythonGIS / Spatial DataCensus Datashinyapps.io